Warmer Gardens
February 6th, 2012
The federal government’s newly unveiled Plant Hardiness Zone Map confirms what we gardeners have known for years — it’s not as cold as it used to be.
After 8 years of work, the U.S. Department of Agriculture updated the map for the first time since 1990, and it shows that most of the country is 1 to 2 degrees warmer in winter.
That’s important because this is the data that plant-sellers use to determine what plants are likely to croak in a given area’s winter. Zone numbers are on all plant tags.
Garden-center buyers generally steer clear of anything outside of their zone, meaning that gardeners who want to “push the envelope” have to go south to buy or order their border-line plants via mail.
Up to now, the Harrisburg area has been rated a Zone 6 — indicative of areas where the winter low, on average, bottoms out between 0 and minus 10 degrees.
Under the new map, about half of our area has inched into the warmer Zone 7– with typical winter lows of 0 to 10 degrees above.
That’s not only consistent with what’s happening nationwide, it’s consistent with what local gardeners have been seeing in the trenches.
Plants that we considered “iffy” in our winter just a few years ago are now fairly safe bets.
We’ve had little trouble lately growing previously “southern” fare such as crape myrtles, nandinas, cherry laurels, hardy camellias, osmanthus and even passion vines and figs.
One upshot is that the new map — posted online at www.planthardiness.ars.usda.gov — might make these plants more widely available. It also is likely to affect the shipping dates of plants bought by mail.
But before you rush out and plant a grove of palm trees, know that the hardiness map has its limits.
Most important: There’s a big difference between averages and trends, which the hardiness map measures, and weather, which as any gardener knows, can be punishingly fickle.
Just because the map says downtown Harrisburg only goes down to 1.3 degrees in an average winter doesn’t mean we won’t get a minus-15 night some week soon. That kind of one-time event is enough to kill an otherwise Harrisburg-hardy plant.
Figuring out what data to use in the first place is part of what took this update so long.
The last time the map was updated, researchers used readings from 1974-1986 — a colder 13-year period.
This time, the team of climatologists, horticulturists and researchers decided that a 30-year window would be more accurate. So they used readings from more than 8,000 U.S. weather stations between 1976 and 2005.
Minute but important specifics also were factored in for the first time, such as whether an area was close to a body of water, atop a peak or in an urban “heat island” surrounded by concrete and asphalt.
The result is a much more detailed map that measures differences down to the half-mile.
The new map also added two warm-weather zones (13 total now), and further broke down the 10-degree zones into 5-degree subzones, designated by “a” and “b.”
It’s very specific, and you can even go online and type in your Zip code to get an exact reading for your neighborhood.
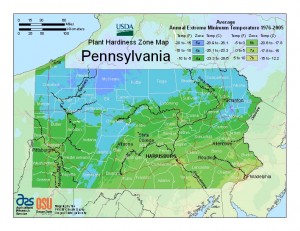
Pennsylvania now ranges from Zone 5a (-15 to -20 degrees) to Zone 7b (5 to 10).
Most of the northern-tier counties, plus a mountainous band leading down through Clearfield, Cambria and Somerset counties, are in Zone 5.
None of central Pennsylvania is in Zone 5 anymore, and most of the West Shore and the area surrounding Harrisburg is into Zone 7a (0 to 5 degrees).
As you head out into the countryside and north of Harrisburg, the lows and the zone ratings go down.
My Hampden Twp. neighborhood, for example, is Zone 7a with an average winter low of 0.3. Camp Hill (0.8) and Middletown (1.1) are in the same zone.
But head out a little into Silver Spring Twp. and the rating changes to Zone 6b with a low of minus 0.3.
Palmyra (-1.5), Hershey (-0.4) and Millersburg (-2.2) also are rated Zone 6b.
Keep going into Hegins (-5.6) or Shamokin (-5.4) and the zone drops to 6a.
That’s remarkably accurate to how veteran gardeners in these areas garden. Folks in Millersburg and Hegins usually wait a week or two longer to plant their tender annuals and tomatoes than do the Camp Hillers and Mechanicsburgers.
Nevertheless, even the level of detail in our official “new normal” doesn’t matter as much as knowing the microclimates in your own yard.
We all have specific spots that can vary by the equivalent or one or even two growing zones.
That borderline shrub that you site next to a west-facing brick wall has a much better chance of surviving than the same one planted at the base of a slope where a surprise late frost might congregate.
In other words, the hardiness map is a good guide, but it’ll never replace the wisdom of a gardener who’s paying attention.
A look at some average winter lows and new plant hardiness zones.
Pennsylvania:
Bradford, Zone 5a (-16.2)
Altoona, Zone 6a (-6.2)
State College, Zone 6b (-4.4)
Pittsburgh, Zone 6b (-3.1)
Gettysburg, Zone 6b (-2.7)
Fort Indiantown Gap, Zone 6b (-2.4)
New Bloomfield, Zone 6b (-2.3)
Mt. Gretna, Zone 6b (-2.0)
York, Zone 6b (-2.0)
Dillsburg, Zone 6b (-1.3)
Elizabethtown, Zone 6b (-0.6)
Carlisle, Zone 6b (-0.5)
Mechanicsburg, Zone 6b (-0.1)
Lancaster, Zone 6b (0)
Penbrook, Zone 7a (0.4)
Longwood Gardens, Zone 7a (0.5)
Red Lion, Zone 7a (0.8)
New Cumberland, Zone 7a (1.1)
Steelton, Zone 7a (2.1)
Philadelphia, Zone 7b (6.0)
Elsewhere:
Minneapolis, Zone 4b (-21.8)
Boston, Zone 6b (-0.6)
Nashville, Tenn., Zone 7a (2.5)
New York City, Zone 7b (5.6)
Washington, Zone 7b (5.6)
Baltimore, Zone 7b (8.7)
Seattle, Zone 8b (18.6)
Orlando, Zone 9b (27.1)
San Diego, Zone 10b (35.2)
San Juan, Puerto Rico, Zone 13a (63.1)


