What the New USDA Hardiness Zone Map Means for Gardeners
February 13th, 2024
If you pay attention to which plants tend to croak in our winters – and as a gardener, you should – you’ve probably noticed less cold-weather mayhem over the past 20 years or so.

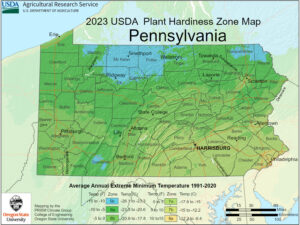
USDA came out with this newly revised Plant Hardiness Zone Map late last fall.
Although our temperatures can nosedive to zero or below, that’s been happening less and less. And as a result, our odds have been growing that we can get away with plants that not too long ago were considered “iffy” at best in our climate.
The U.S. Department of Agriculture has now verified what gardeners have been suspecting for years – our winters generally aren’t as plant-killing cold as they used to be.
USDA late last fall released an updated version of its Plant Hardiness Zone Map – the official, national guide that gardeners and farmers use to estimate how low temperatures are likely to plunge in an average winter.
These zones are listed routinely on plant tags and are a key determiner of what plants gardeners plant in a given area and which ones garden centers carry in the first place.
The new map is based on 30 recent years of nationwide observations – from 1991 to 2020 – that show our winter lows are about two degrees warmer, on average, than the decades before.
USDA last updated the map in 2012, using temperature readings from 1976 through 2005.
The readings went up enough over the more recent period to cause USDA to shift about half of the country – Pennsylvania included – into higher half-zones.
The USDA map divides the country into 13 cold-hardiness zones that are, in turn, divided into even more precise five-degree half-zones.
Up to now, most of central Pennsylvania has fallen into Zone 6b, indicating winters that historically bottom out, on average, between zero and minus-5 degrees.
Hershey, for example, was previously rated as Zone 6b while more northerly Hegins and Shamokin were previously rated Zone 6a (minus-5 to minus-10).
USDA’s new data shifts almost all of the Harrisburg area into Zone 7a, meaning average lows of zero to 5 degrees above zero.
Making the jump from Zone 6b to Zone 7a are municipalities such as Hershey, Palmyra, Carlisle, New Bloomfield, Duncannon, Dillsburg, Elizabethtown, Lancaster, York, and Gettysburg.
Harrisburg, Camp Hill, Middletown, Mechanicsburg, New Cumberland, Lemoyne, East Pennsboro Twp., Lower Paxton Twp., and Shippensburg already were in Zone 7a.
Areas to the north of Harrisburg are now mostly in Zone 6b, including Halifax, Hegins, Shamokin, State College, Scranton, and Altoona.
You can find out your exact hardiness zone by going to the USDA 2023 Plant Hardiness Zone Map website and typing in your Zip code.
Now before you rush out and plant a grove of palm trees this spring, know that the hardiness map has its limits.
As USDA officials point out, the map is based on average lows over a given period, not all-time lows.

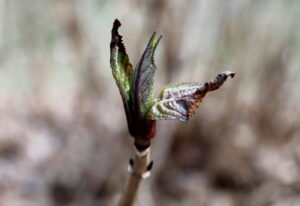
Even a single sudden cold night is enough to do this to a newly opened leaf bud.
That means a brief, rogue cold spell can go below the listed averages, killing a plant that otherwise would survive an average winter.
That happened a year ago when temperatures plunged below normal on Christmas Eve 2022, resulting in damage despite a winter that went on to become one of our warmest on record.
The map also doesn’t tell us how long low temperature stay low or how often it got down to that point. A borderline-hardy plant might recover from a few hours of, say, single-digit readings. But if the temperatures go that low several nights in a row and stay that low for eight or 10 hours each night, you’re probably looking at a dead, brown blob.
More importantly, the USDA averages don’t factor in the increasingly erratic ups and downs or the effects that hotter, drier summers can have on a plant’s winter fitness.
Plants are pretty good at adapting to gradual changes in weather and climate. They’re not very good at dealing with shock.
Read George’s post on How One of the Warmest Winters Ever Caused Some Of Our Worst Plant Damage Ever
On the other hand, this latest USDA map is the most accurate yet.
For one thing, the number of weather stations used in reporting went from 7,983 for the 2012 map to 13,412 stations for the 2023 map.
The new map also takes into account more factors that can affect winter lows, such as whether an area is close to a body of water, atop a peak, or in an urban “heat island” surrounded by concrete and asphalt.
The result is a detailed map that measures differences down to the half-mile.
The bottom line is that the zone map is a useful tool but not a guarantee that if you stick with, say, Zone 7a-rated plants, you’ll never lose one to the cold.
It at least indicates our odds are getting better of growing plants that once were considered borderline-hardy in our winters.

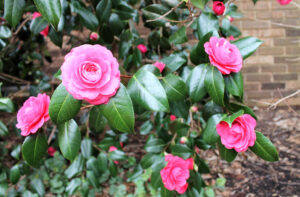
Camellias are a “southern” plant becoming a better bet in central Pennsylvania’s recent climate — especially ones rated for Zone 6.
Those include somewhat southerly fare such as crape myrtles, nandinas, cherry laurels, hardy camellias, osmanthus, figs, passion vines, photonias, and even some cold-hardier gardenias.
Many of those are rated for Zones 7 and up, so now that most of south-central Pennsylvania is considered to be in that zone instead of the colder Zone 6, those plants are a safer bet.
We’re now kind of like what Baltimore used to be, if that gives you any idea.
Pennsylvania as a whole ranges from a low of Zone 5b (the northern counties of McKean and
Potter, parts of far northeastern Susquehanna and Wayne counties, and a sliver of Somerset County) to a high of Zone 8a (the warmest parts of Philadelphia).
The range went from Zone 5a to Zone 7b in the 2012 map.
The new map was developed jointly by USDA’s Agricultural Research Service and Oregon State University’s PRISM Climate Group.


